DevOps, Day - 79
Now, the next step is to learn about the Prometheus. It's an open-source system for monitoring services and alerts based on a time series data model.


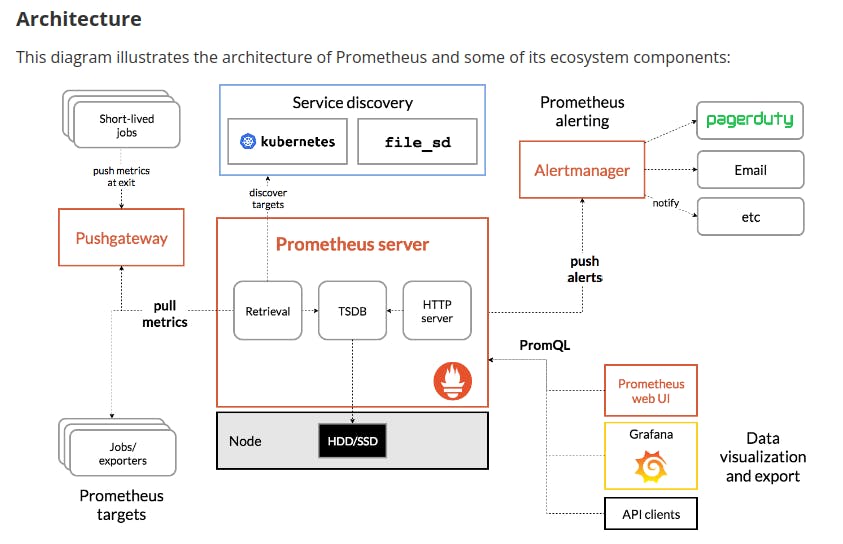
The architecture of Prometheus Monitoring: Prometheus follows a pull-based model that scrapes metrics data from monitored targets. It uses a multi-dimensional data model to organize and query these metrics. The key components of Prometheus architecture include:
Prometheus Server: This central component collects and stores time-series data, evaluates alerting rules and exposes a web UI for visualization and querying.
Data Scrapers: These components, known as "exporters," are responsible for exposing metrics from the target systems, which Prometheus scrapes on a regular basis.
Alert Manager: Responsible for handling alerts sent by the Prometheus server and performing actions like silencing, aggregation, and routing them to appropriate receivers.
Pushgateway: An optional component that allows short-lived jobs to push their metrics to Prometheus.
Client Libraries: Various client libraries are available for instrumenting applications and exposing their metrics to Prometheus.

Multi-dimensional Data Model: Metrics are identified by a unique combination of labels, allowing for rich querying and aggregation.
PromQL Query Language: A powerful and expressive language for querying and alerting on metrics data.
Service Discovery: Support for dynamic service discovery and monitoring of containerized applications.
Alerting: Define alerts and use the Alert Manager to handle them.
Scalability: Designed for horizontal scalability to handle large environments.
Remote Storage and Long-Term Storage: Can be configured to store data in remote or long-term storage systems.
Pull-Based Model: Efficiently collects data from targets, reducing network and target resource usage.
Docker and Kubernetes Integration: Well-suited for containerized environments.
Exporters: A variety of exporters for popular services and platforms are available.
Built-in Web UI: Provides visualization of metrics data and query capabilities.

Prometheus Server
Data Scrapers/Exporters
Alert Manager
Pushgateway
Client Libraries for Instrumentation
Database Used by Prometheus: Prometheus uses its own custom time-series database that is optimized for efficiently storing and querying time-series data.
Default Data Retention Period in Prometheus: By default, Prometheus retains data for 15 days. You can configure this retention period according to your needs by setting the --storage.tsdb.retention.time flag when starting the Prometheus server.
Thank you so much for reading
Follow me on LinkedIn to see interesting posts like this : )
