DevOps, Day - 77
Alerting

💻 Python | Docker | Jenkins | Networking | Git | Linux 💻
Passionate about leveraging technology to drive efficiency and deliver innovative solutions. Proficient in Python development, Docker containerization, Jenkins automation, computer networking, Git version control, and Linux administration. Skilled in collaborating with diverse teams to deliver high-quality software products. Proficient in AWS EC2 instance management and deployment.
Seeking new opportunities to apply my expertise and contribute to impactful projects. Let's connect and explore how we can work together!
Inter-personal Skills:
Communication, Adaptability, Emotional intelligence, Active listening, Collaboration.
Happy To Connect🔗😊
Feel free to reach me out😃@ --> vrishnishreevb531@gmail.com 📬
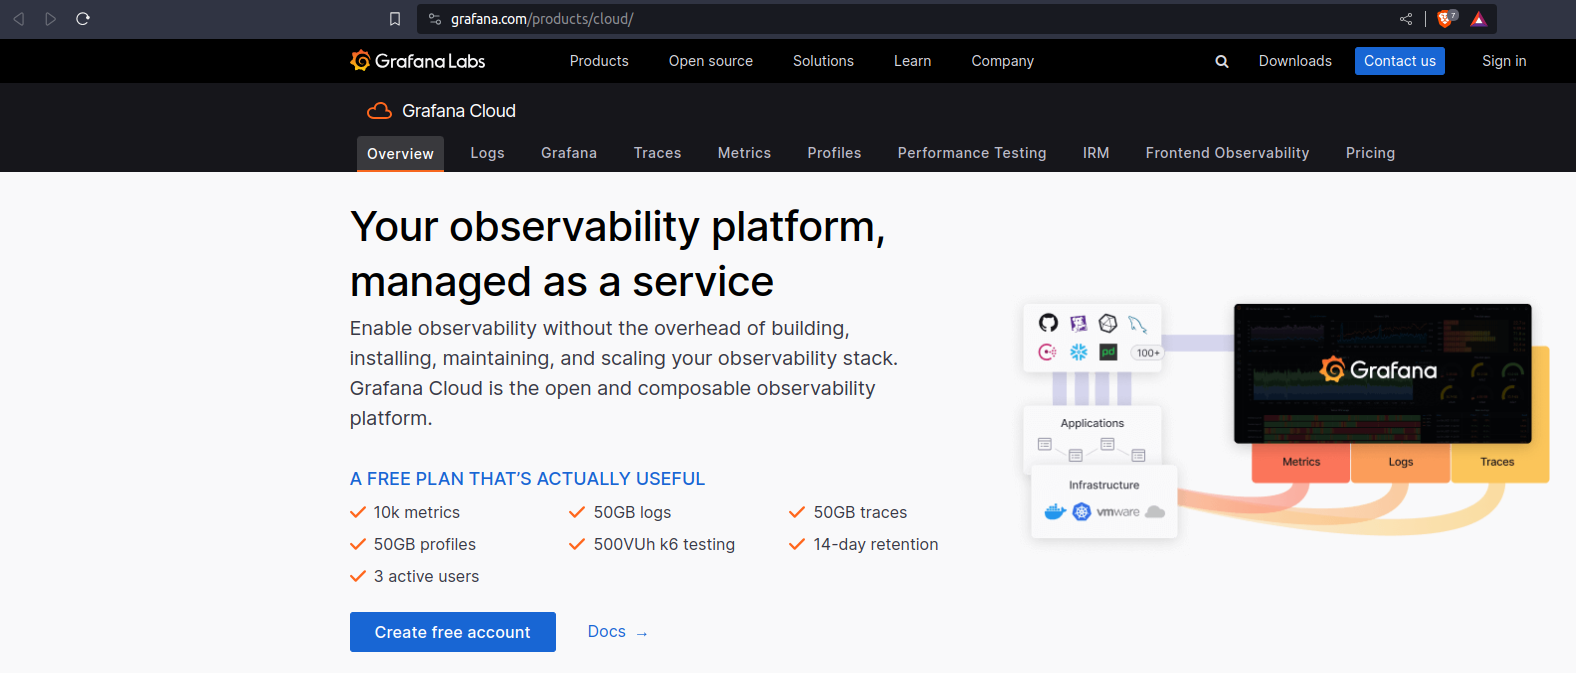
Grafana Alerting allows you to learn about problems in your systems moments after they occur. Create, manage, and take action on your alerts in a single, consolidated view, and improve your team’s ability to identify and resolve issues quickly.
Grafana Alerting is available for Grafana OSS, Grafana Enterprise, or Grafana Cloud. With Mimir and Loki alert rules you can run alert expressions closer to your data and at a massive scale, all managed by the Grafana UI you are already familiar with.

Click on Grafana cloud and create a free account.

Click on "I'm already familiar with Grafana"

Now we can see something like this...
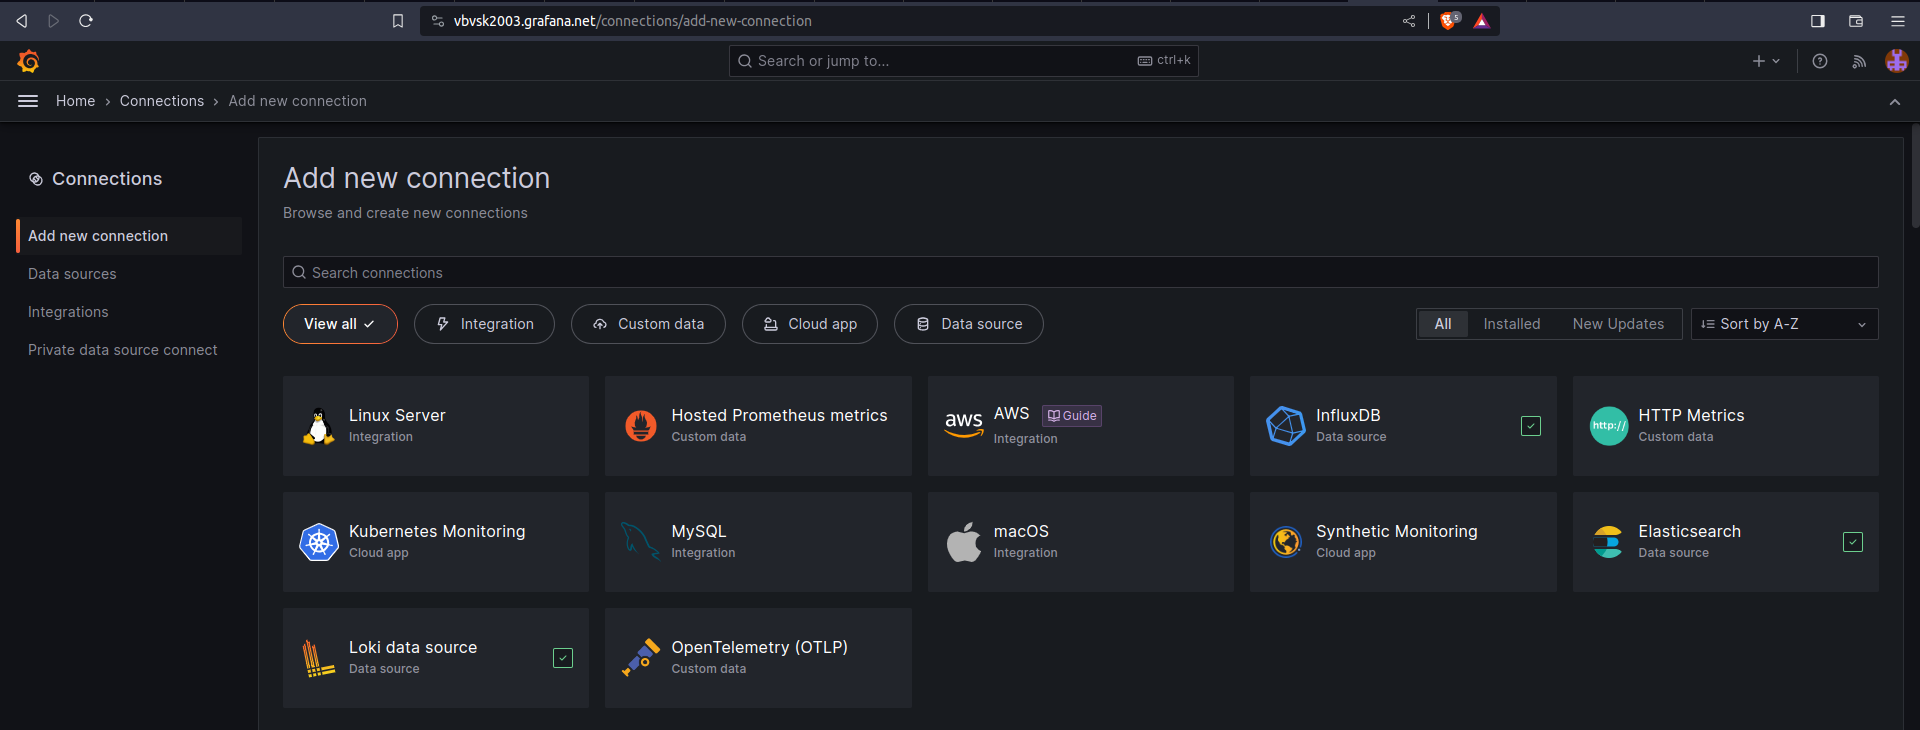
Great! Since you've already set up Grafana Cloud, let's proceed with setting up a sample alert in Grafana Cloud. Here are the steps to create a simple alert:
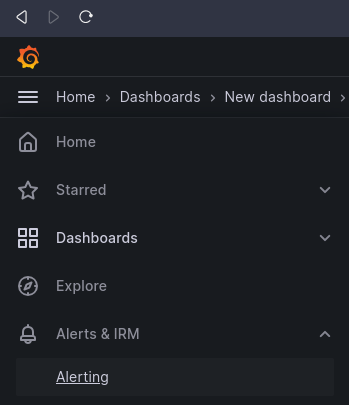
Create a Dashboard:
In Grafana, you'll typically start by creating a dashboard to visualize your data. If you haven't already created a dashboard, you can do so by navigating to the "Create" menu and selecting "Dashboard."


Add a Panel:
In your newly created dashboard, click the "Add Visualization" button.

Configure the Panel:
In the panel editor, select a visualization type and configure your data sources, such as Prometheus, InfluxDB, or any other data source you're using with Grafana Cloud. (i have selected Prometheus)

Set Up the Alert:
In the panel editor, go to the "Alert" tab.

Click the "Create Alert" button to create a new alert.

Define Alert Conditions:
Configure the conditions for your alert. For example, you can set conditions like "WHEN value IS ABOVE X for Y minutes."


Save the Alert:
Once you've configured the conditions and notifications, click the "Save" button to save your alert.
After saving we, can see something like this.

Click on.

Click on View


Thank you so much for reading
Follow me on LinkedIn to see interesting posts like this : )


