

Hope you all have docker installed by this time : )
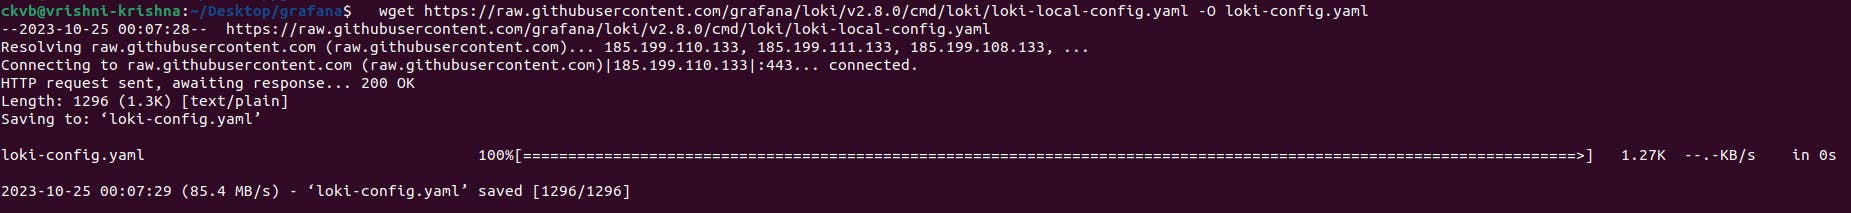
Now Download the Loki Config file into your current directory.
wget https://raw.githubusercontent.com/grafana/loki/v2.8.0/cmd/loki/loki-local-config.yaml -O loki-config.yaml
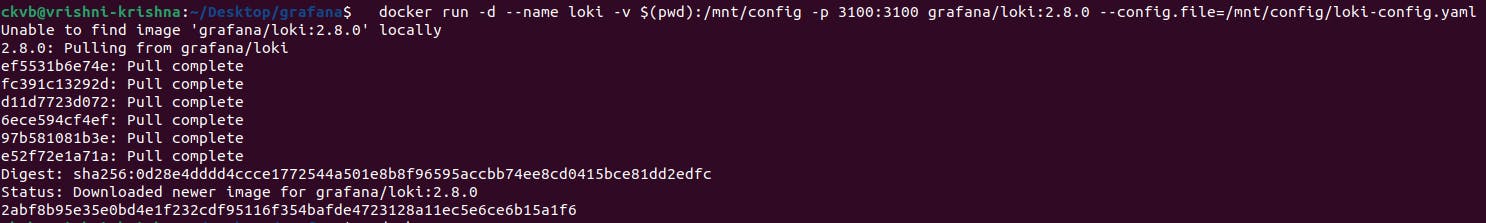
Run the Loki container
docker run -d --name loki -v $(pwd):/mnt/config -p 3100:3100 grafana/loki:2.8.0 --config.file=/mnt/config/loki-config.yaml
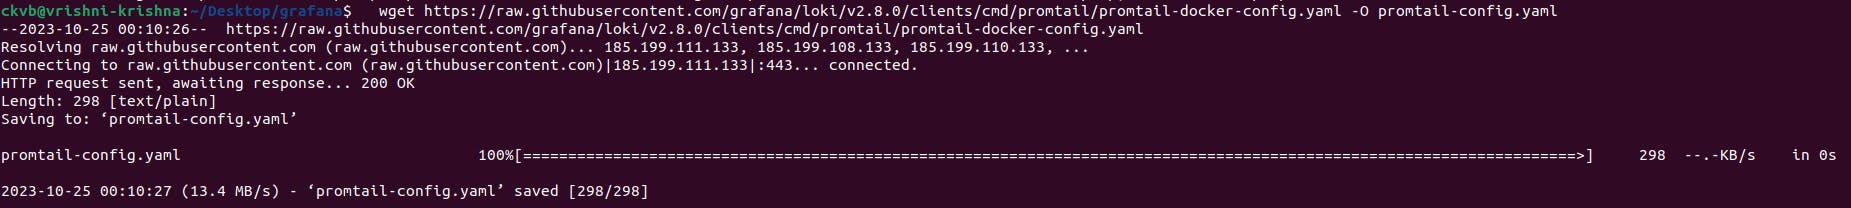
Now download the Promtail Config yaml file.
wget https://raw.githubusercontent.com/grafana/loki/v2.8.0/clients/cmd/promtail/promtail-docker-config.yaml -O promtail-config.yaml
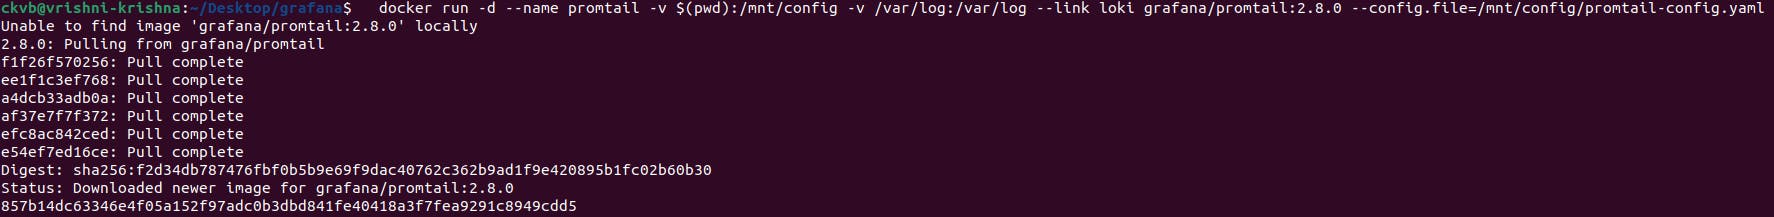
Now execute the Promtail container.
docker run -d --name promtail -v $(pwd):/mnt/config -v /var/log:/var/log --link loki grafana/promtail:2.8.0 --config.file=/mnt/config/promtail-config.yaml
Now type the docker ps command to see our running containers.
docker ps

Login to the Grafana Home Page
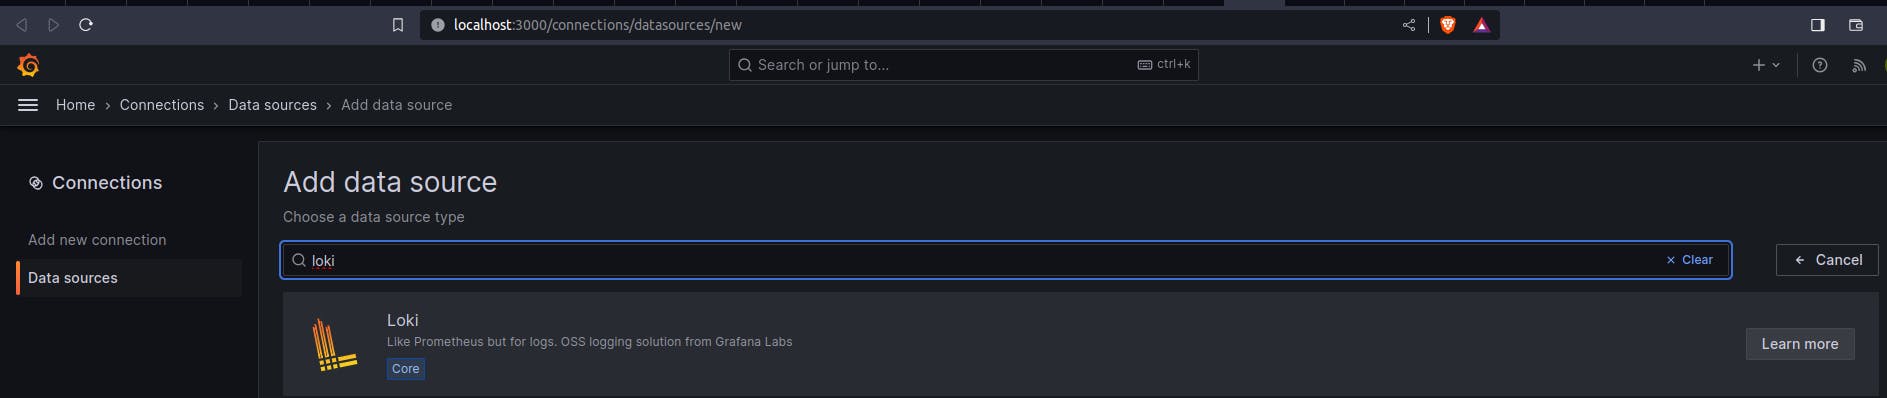
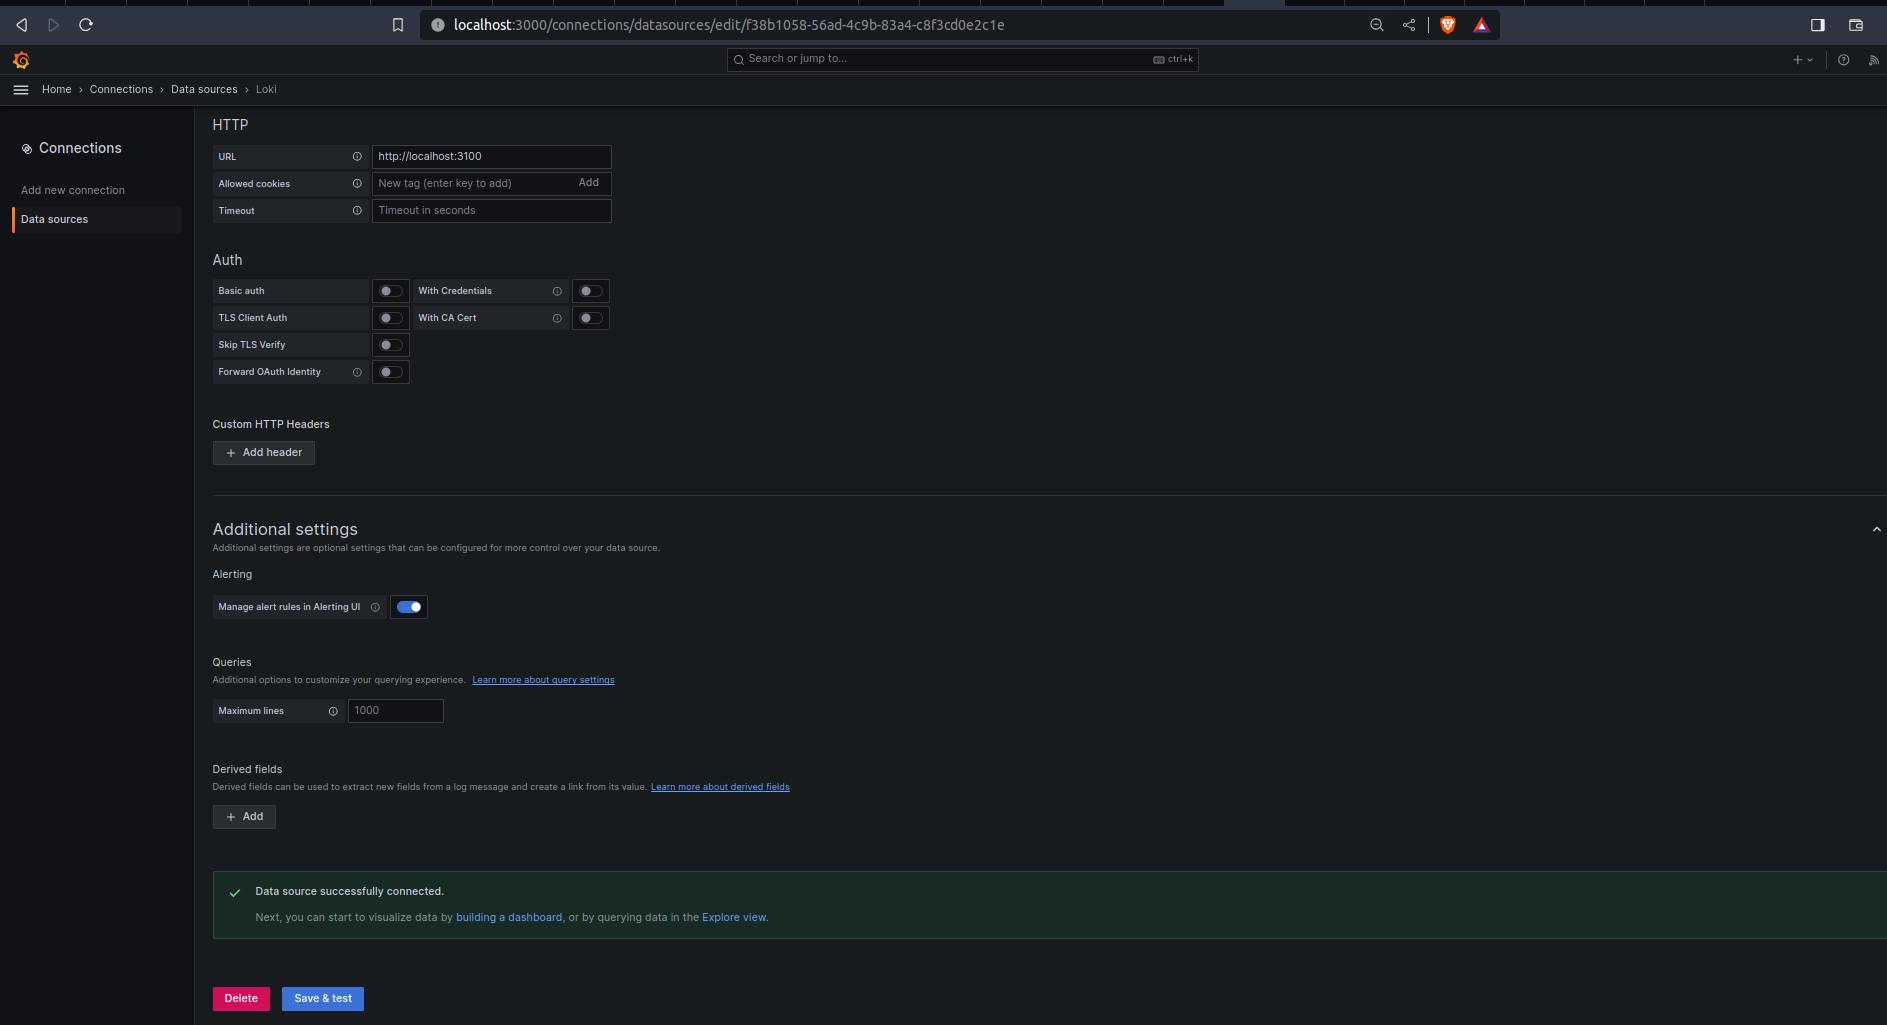
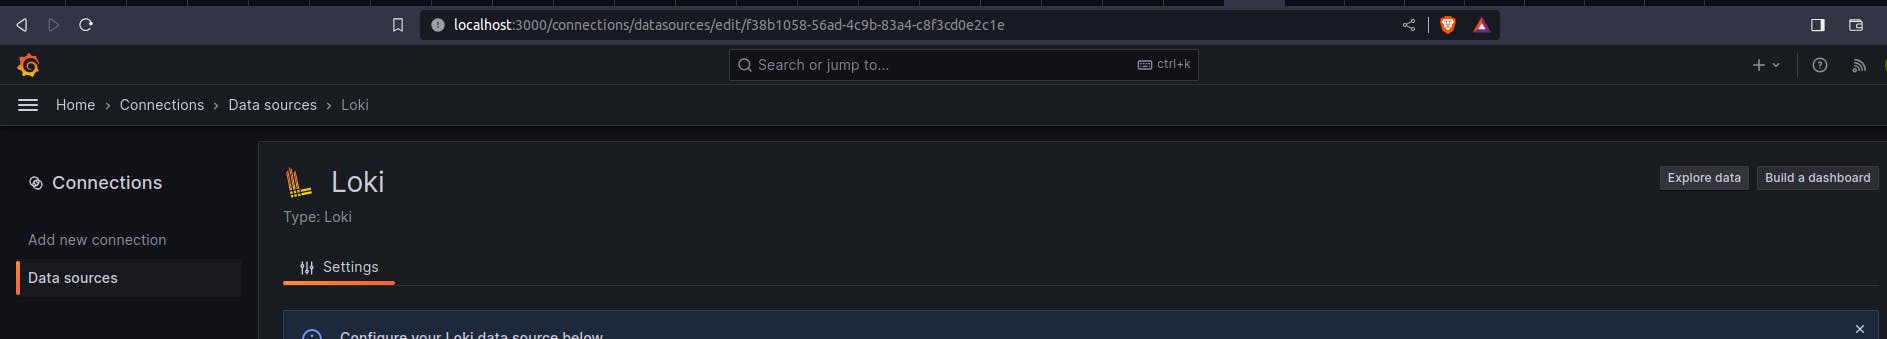
Add Loki as a data source
Paste this URL --> localhost:3100 --> Save and Test
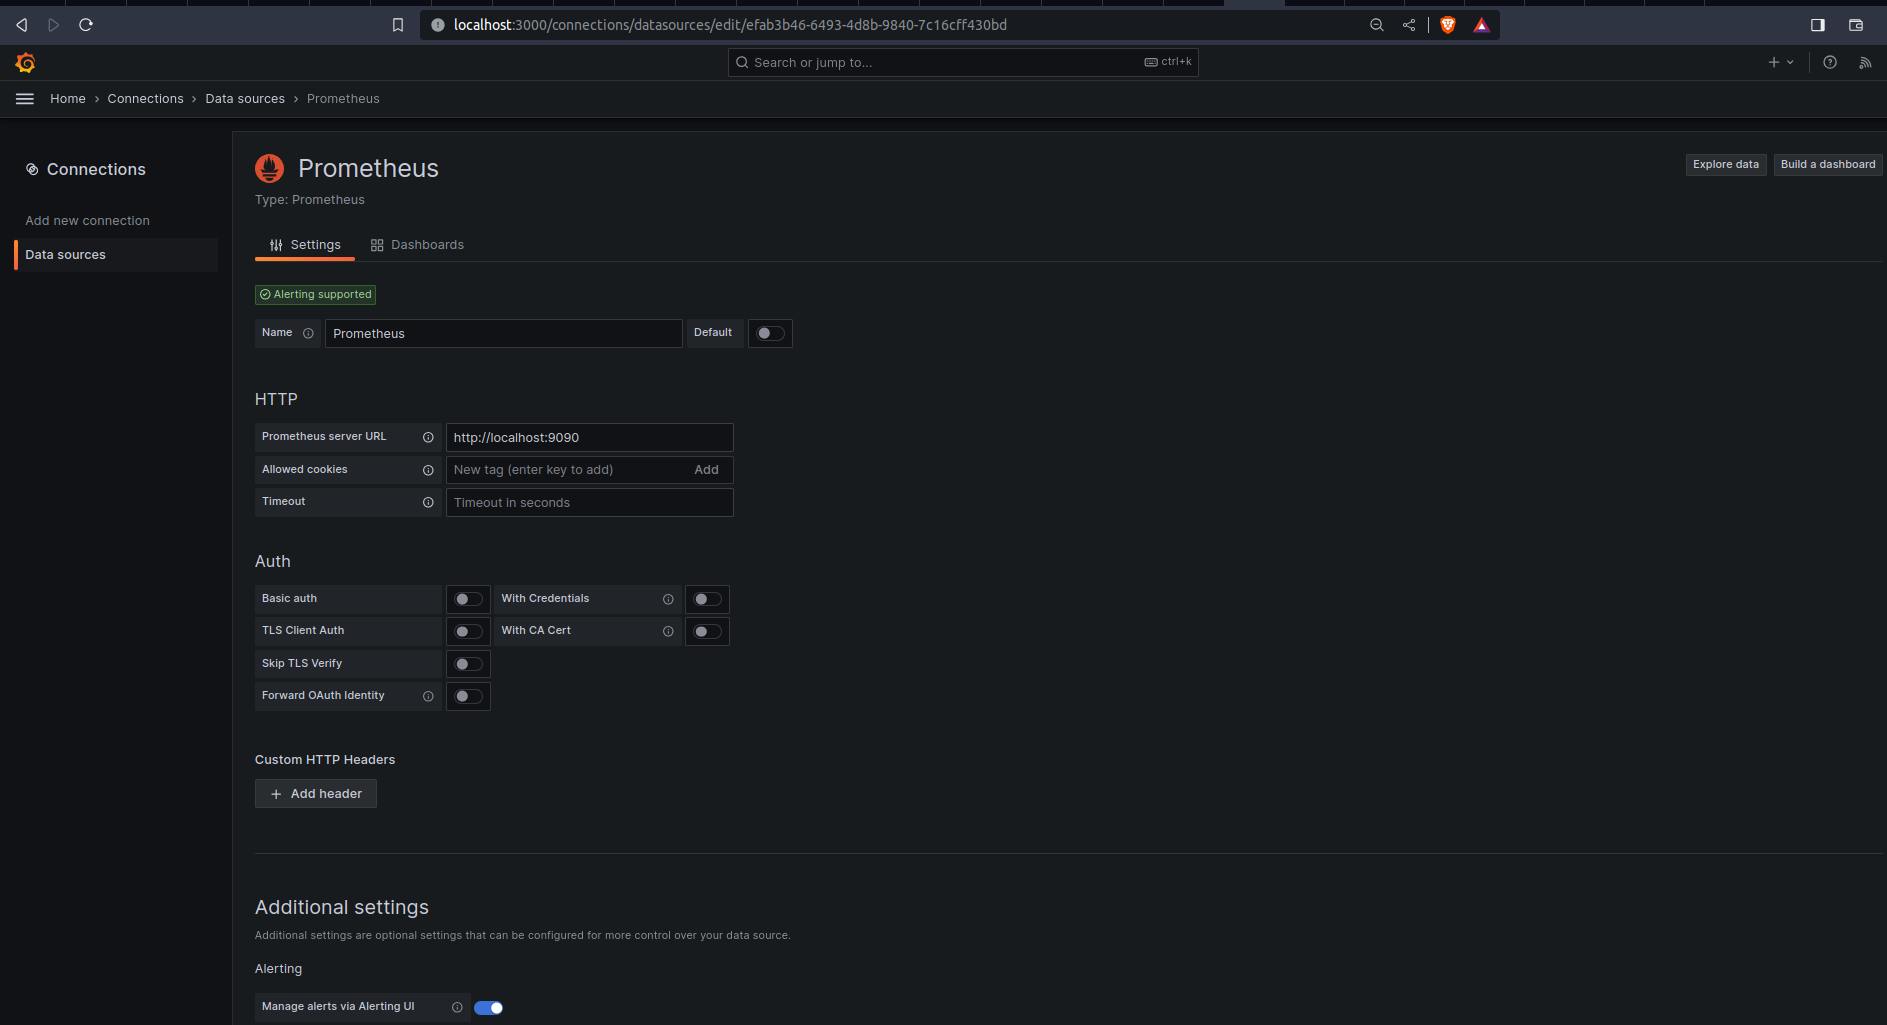
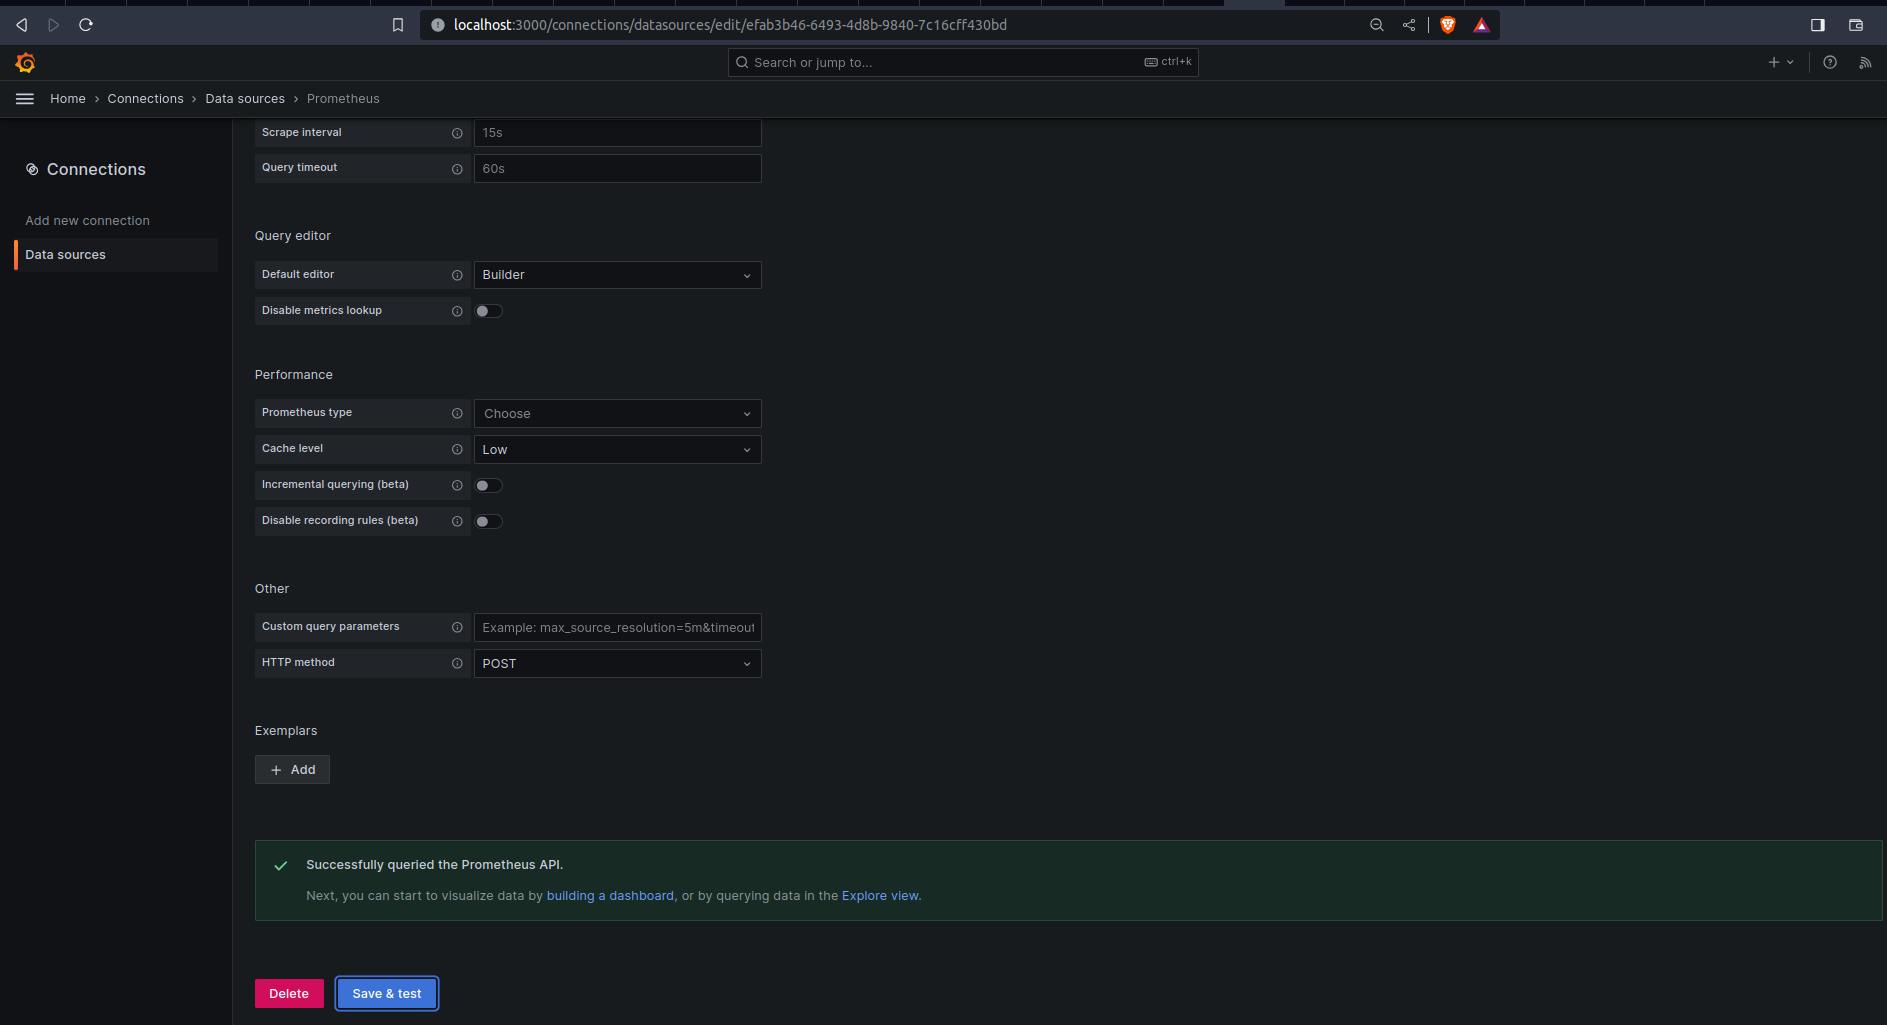
Add Prometheus as a data source
Paste this URL --> localhost:9090 --> save and test.
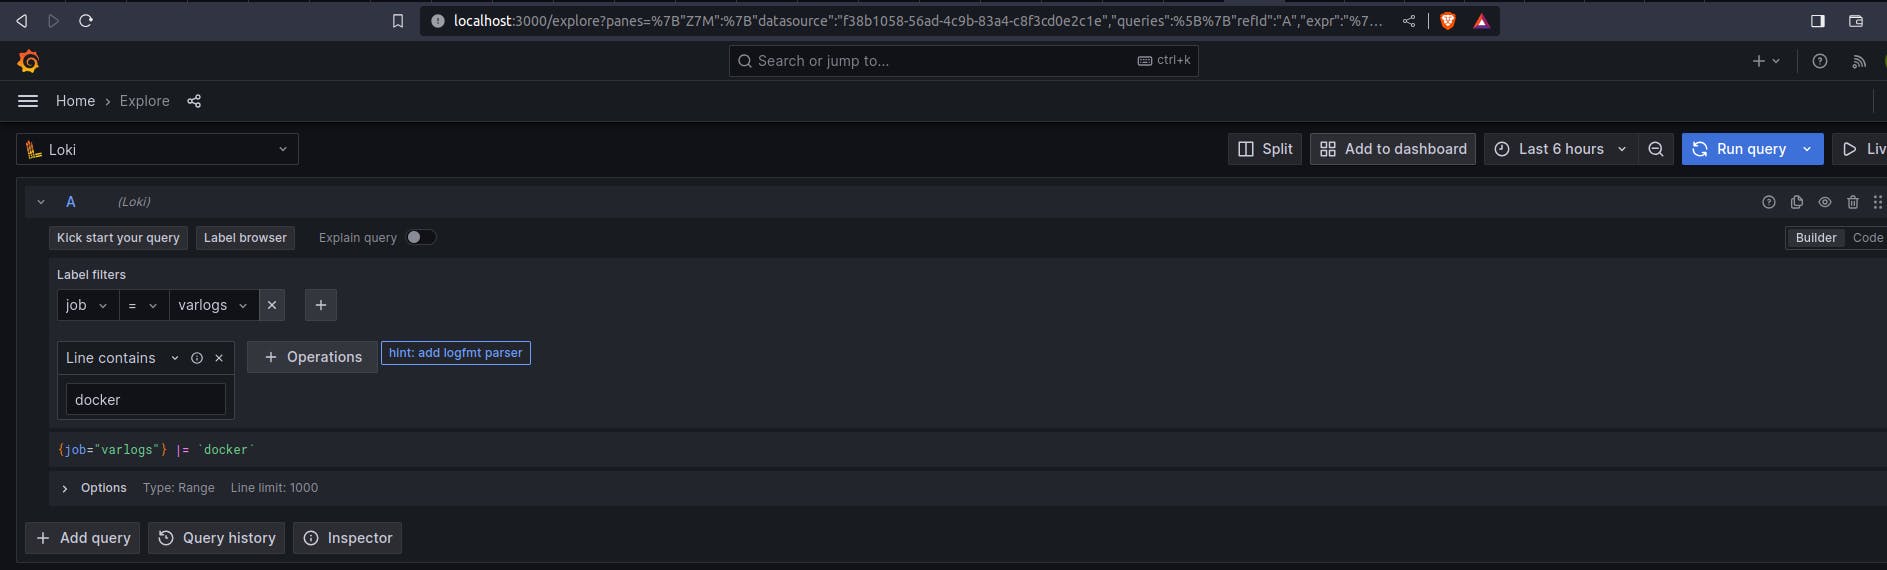
Scroll up --> click on explore
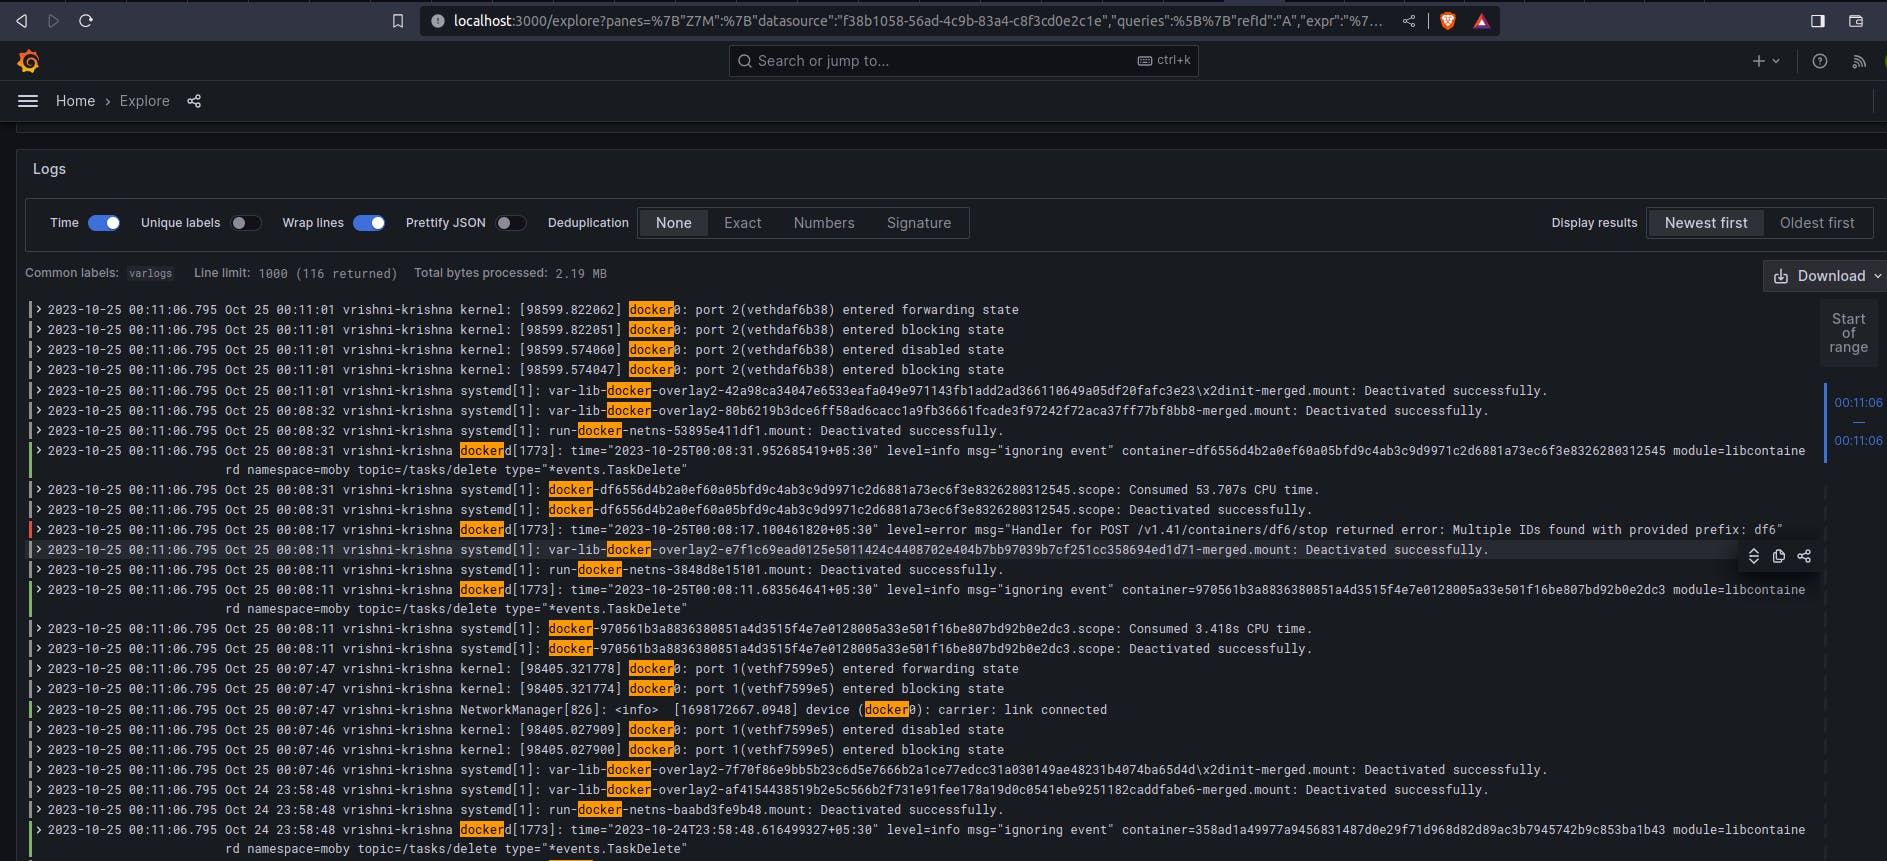
Fill (Label Filters --> jobs, varlogs), (Line Contains -> docker) --> click on run query
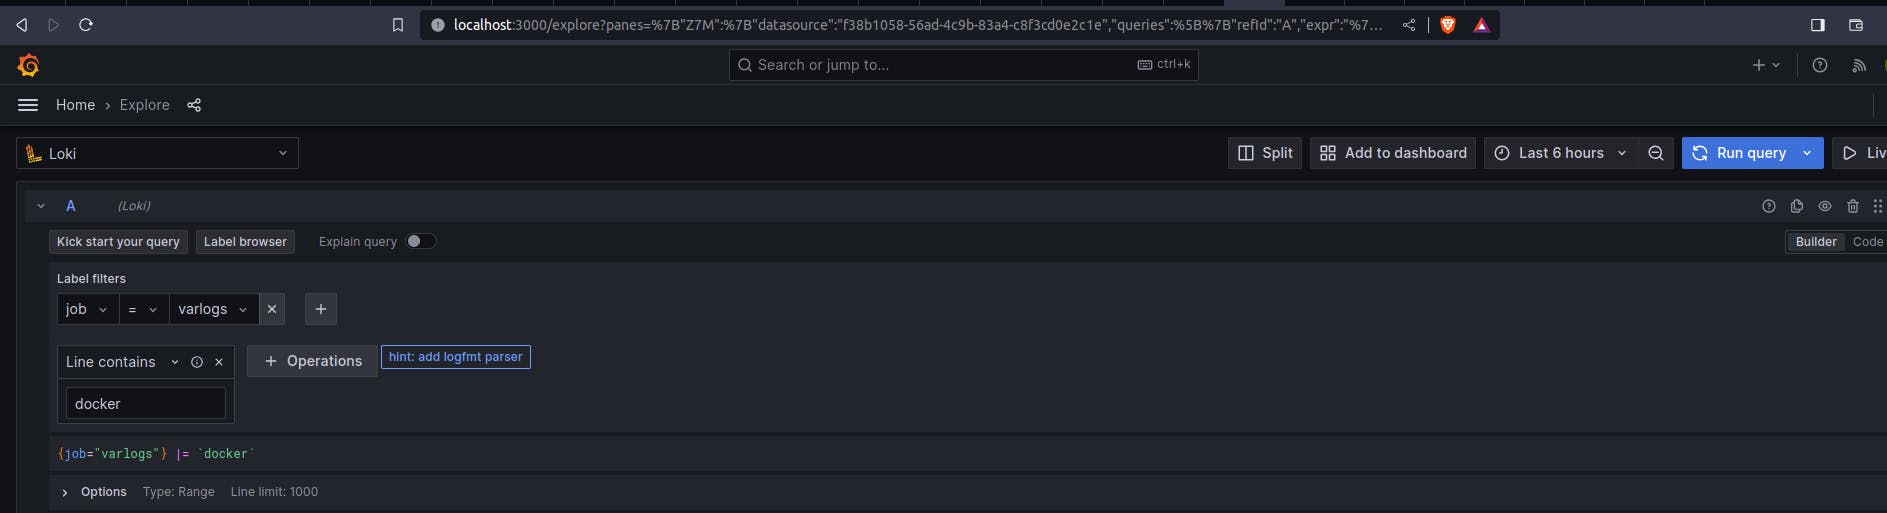
And this is the output...
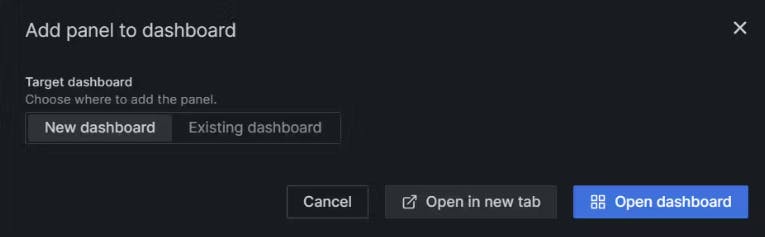
Now click on add to dashboard
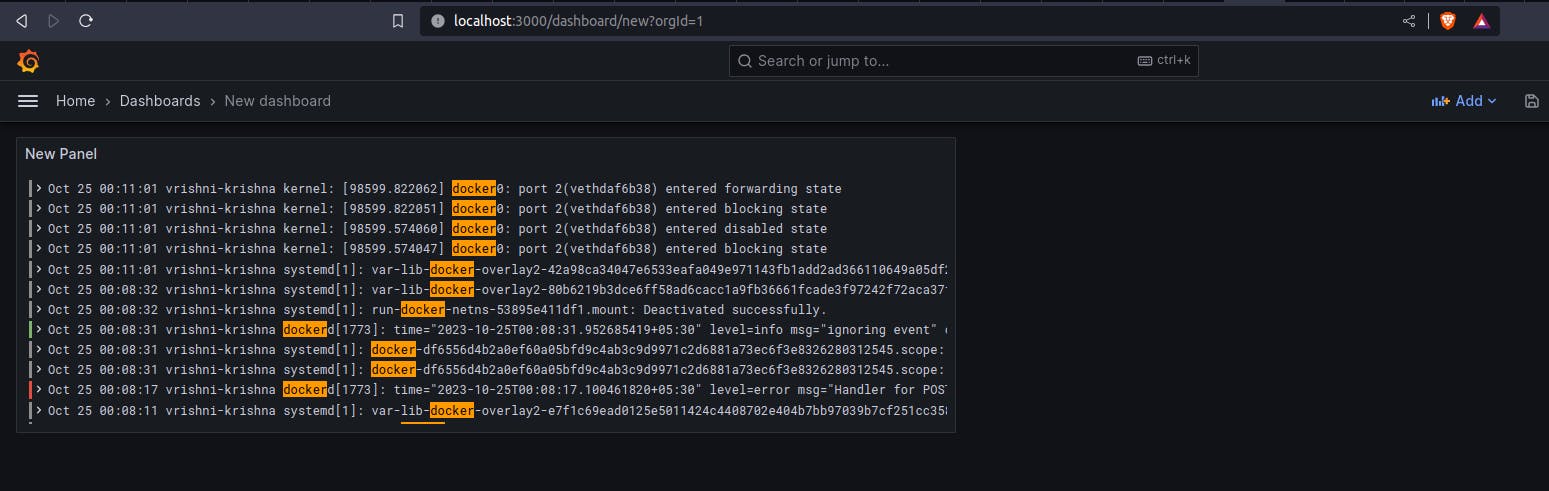
click on open dashboard, and we can see our panel.
Thank you so much for reading
Follow me on LinkedIn to see interesting posts like this : )